Blueprint Optimization In Unreal (UE4/UE5)
During the course of development, you will inevitably use blueprints. Blueprints are fast and easy to iterate on, designers often create things using them, as they are easy to use, and UI is near impossible without the use of blueprints. However, if your game is bound on your CPU’s game thread, then you will need to seriously look into your code, and it’s very likely blueprints are responsible. This is due to the fact that blueprints are much slower than equivalent C++ code. It seems to be hard to find a concrete difference between speeds, and it will depend on what the node is doing, however, I have seen estimates that pin each blueprint node as being around 20x slower than it’s C++ equivalent. Knowing this, you will need to analyze your current blueprints in your project, determine which functions are causing you the biggest slowdown, and make alterations within the blueprint, or migrate functionality over to C++.
In this article, I’ll cover how to analyze your game, review the time complexity, and show how to change a piece of functionality to improve performance, or integrate a piece of functionality over to c++ and start calling that from within Blueprints. Due to the speed of C++ over blueprints, even though it is a little painful, I encourage you to write in the base API for a function, or the variables required within C++ originally, even if you intend to only use Blueprints for all of your functionality. This will make the process much easier, as you don’t have to redefine functions or variables within C++, and then go into the blueprints and replace all references to the old variables and functions to the versions in C++. Not to mention if you are changing something like a struct, or a more complex structure, copying over any default, or inspector set values will be a major headache, especially if this struct is widely used as a data table component.
Initial Analysis
First, just making sure you know that you are CPU bound, you can run the in-game command (to open the command prompt, press the ` key) and type in the command
stat unitThis will display timing information on the side of your screen, such as frame time, game time, draw time, and gpu time. It’s important to note that Draw is on the CPU as well, however, runs on a different thread than the Game thread, which holds all of your game code. In this article, we will be talking about lowering the Game thread time specifically.

Once you are sure that the Game thread is what needs fixing, you can then type in the command
stat gameThis command lists out, in order of severity, all the tasks that your game thread is working on, the things that will most likely be highest on this list would be things like Physics, or World Tick. Move Actor is a big one as well, and often occurs within blueprints. The main thing to check here is that the longest operation here is in fact your blueprints. If your slowest operations are in Physics, you should most likely look to see how your physics could be simplified over your game code.

Real Analysis
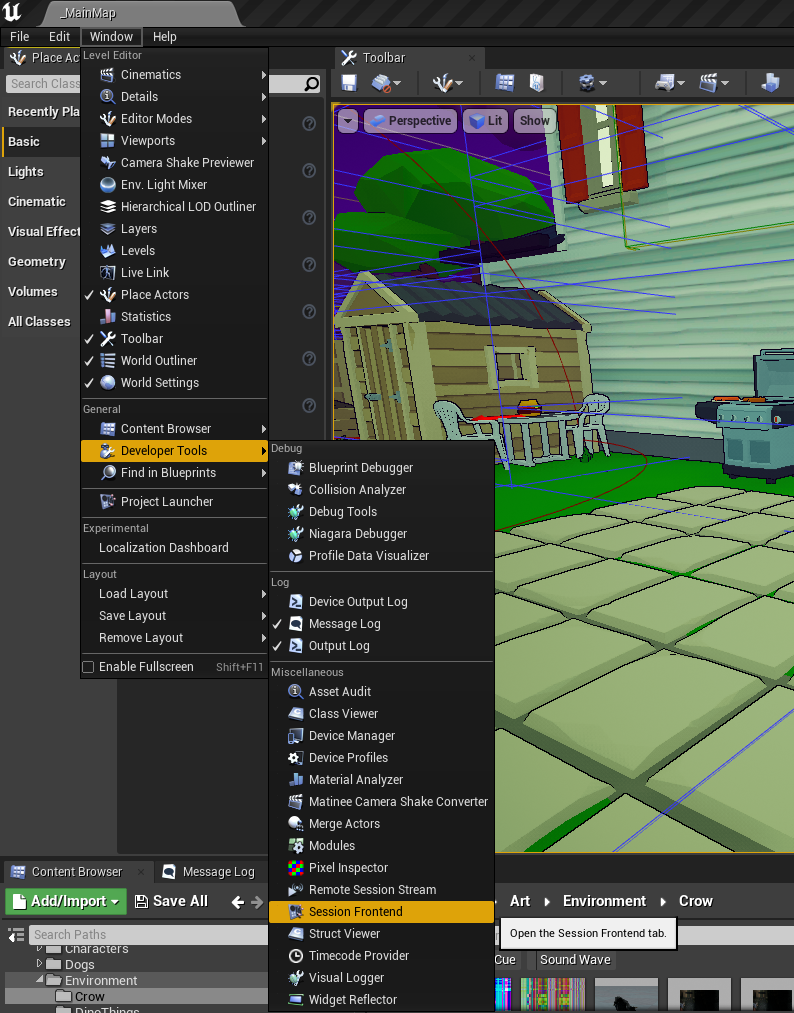
Once you are certain that your Game thread is holding you back, and that the blueprint code is taking the longest time on that thread, it’s time to record some real data and take a look! Unreal doesn’t do a great job of letting you know about this tool, but they actually have a really great Blueprint profiling tool that many are unaware of. It can be found within the “Session Frontend” tool (Window->Developer Tools->Session Frontend). However, the blueprint profiling section of this tool will be empty until we record data and then open that file in the program.
To start recording data, start playing your game (PIE) and get to the section you would like to record data for. Type in the command:
stat StartFileUnreal will start caching profiling data every frame, in the upper-left portion of the screen, you will see how long you have been recording, and how large the file size is. Play your game doing whatever you would like to test, and then once you’re done, simply type out the command:
stat StopFileThis will stop recording data, and save the output to a file on disk. This file can be found at
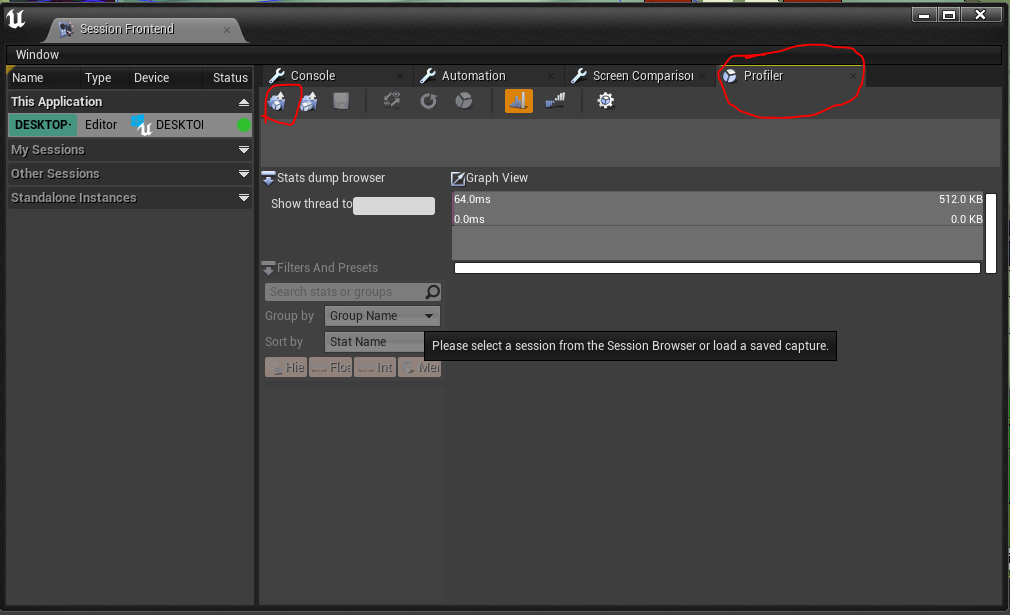
"{PROJECT-DIR}\Saved\Profiling\UnrealStats\UEDPIE_0_{MAP-NAME}-{PLATFORM}-{DATE-TIME}\UEDPIE_0_{MAP-NAME}-{PLATFORM}-{DATE-TIME}.ue4statsIf we open up the Session Frontend tool again, and navigate over to the Profiler tab all the way on the right, we can now click the gear to load up this file within the tool.
Once loaded, you will see a graph of frame timings, I typically like to look at any spikes, as well as an average frame, to see what is most slow some of the time, as well as what is typically the most slow. Once you click on a frame, you will see a whole list of more specific timings underneath, and Blueprints can be found within the GameThread section. Open this section, and just keep opening the top-most element to drill down into the slowest function (Event Name->GameThread->FrameTime->FrameTime->World Tick Time-> Tick Time->TG_PrePhysics->ReleaseTickGroup Block->Game TaskGraph Tasks->FTickFunctionTask). Once mostly expanded, you will have a pretty good idea of what function is the slowest, and which part of that function makes it so slow.
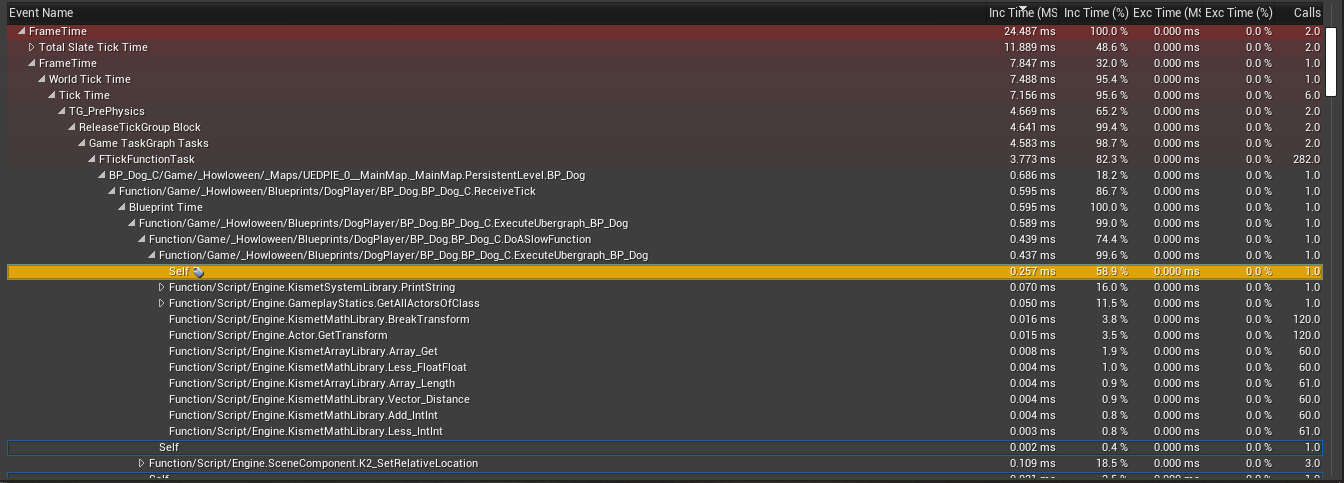
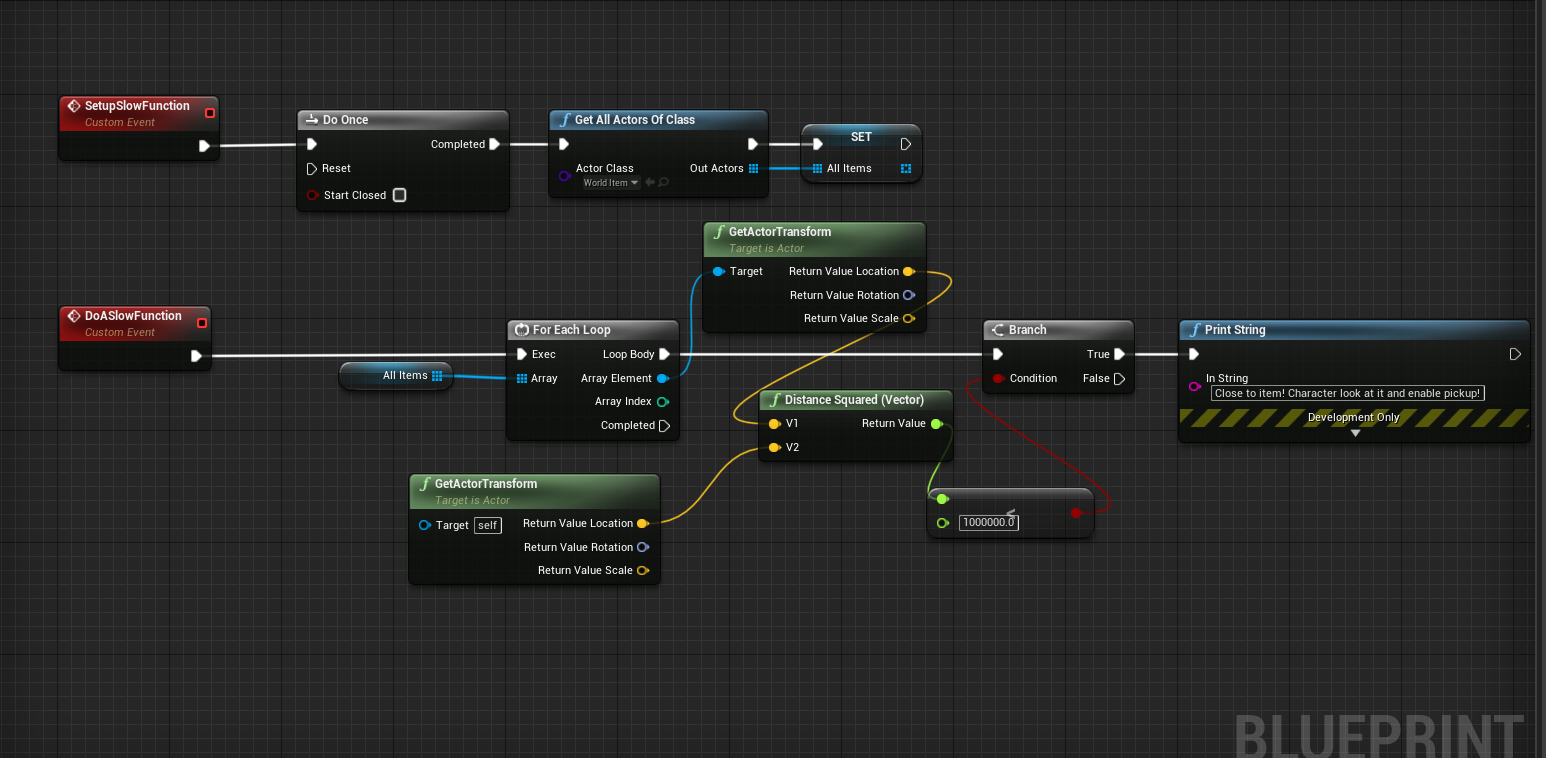
Currently, as can be seen here, my slowest blueprint is the BP_Dog blueprint, and when opening that, I can see which functions are slowest, here we see that the slowest function is “DoASlowFunction”, opening that, we can see where the time of that function is being spent. The function itself is slowest and all nodes directly within the function (.257 ms). The next largest portion being PrintString (which is in debug, non-shipping builds, so not worth optimizing, unless it’s making our editor too slow.) (.07 ms) After that, the next biggest aspect is GetAllActorsFromClass (.05ms). We can see the other operations happening directly within the function nodes.
When looking to improve this, always work from the most expensive, to least, however, in this case, I will ignore the PrintString, as I want to see that info, and it won’t effect the game once it ships and is built anyway. Here, we can try and tackle the single largest function, being the GetAllActorsOfClass, we can simply fix this by pre-caching the list. We can also try and simplify the Distance check into a squared distance check, as squared distance is always much faster! Here we can see the current implementation:
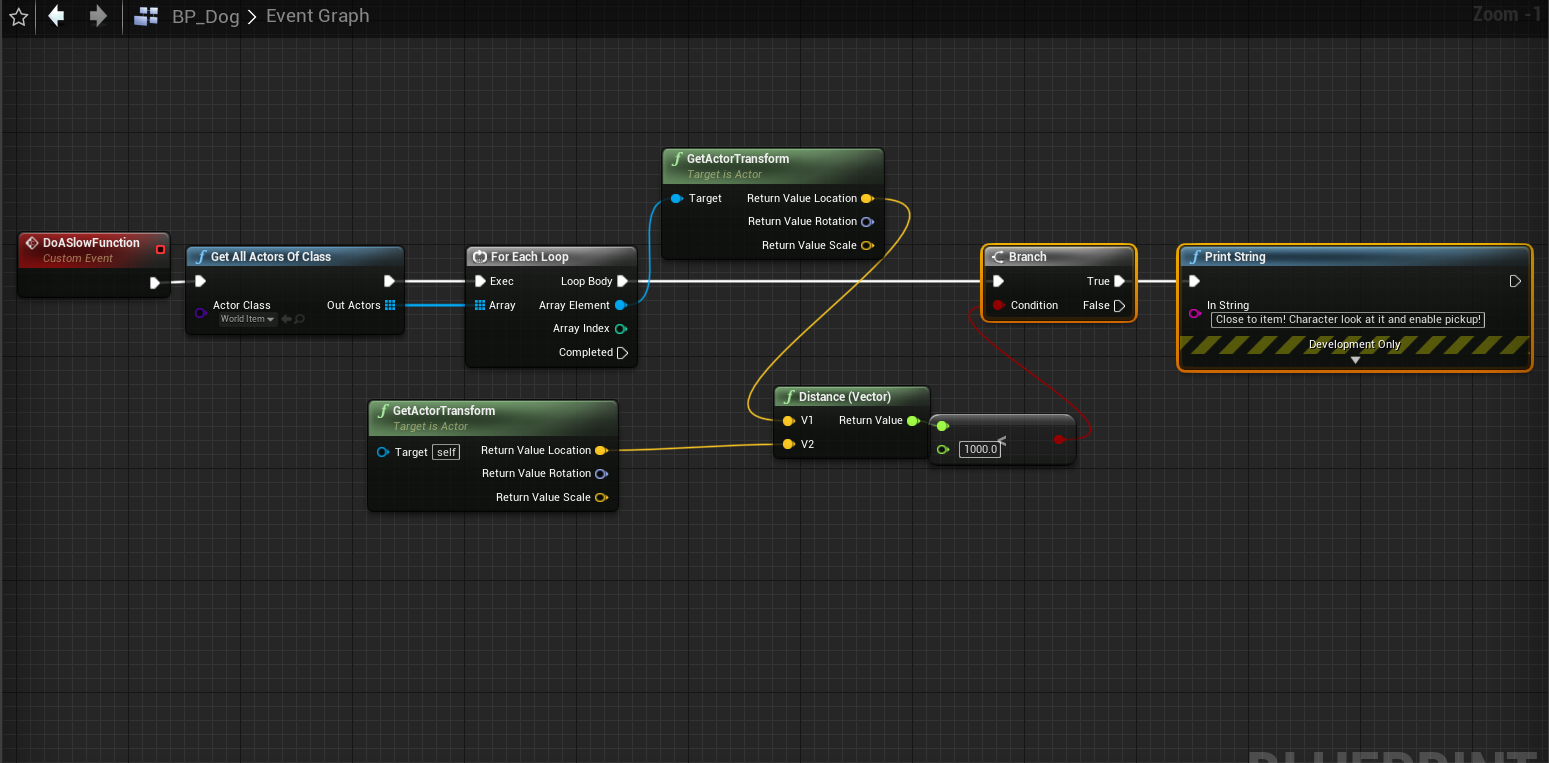
Looking at the function, we can see that we get all of the items, and check which ones are in range for us to interact with. It doesn’t seem crazy, yet it ends up running rather slow!
Immediately, we can see that we could remove the GetAllActorsOfClass, by getting them only once, and then using them many times later on in this function that runs every frame. We can also replace the Distance check as mentioned earlier. With those changes it looks like this:
With these small changes, we get this new result when re-recording the Stat startfile and stat stopfile.
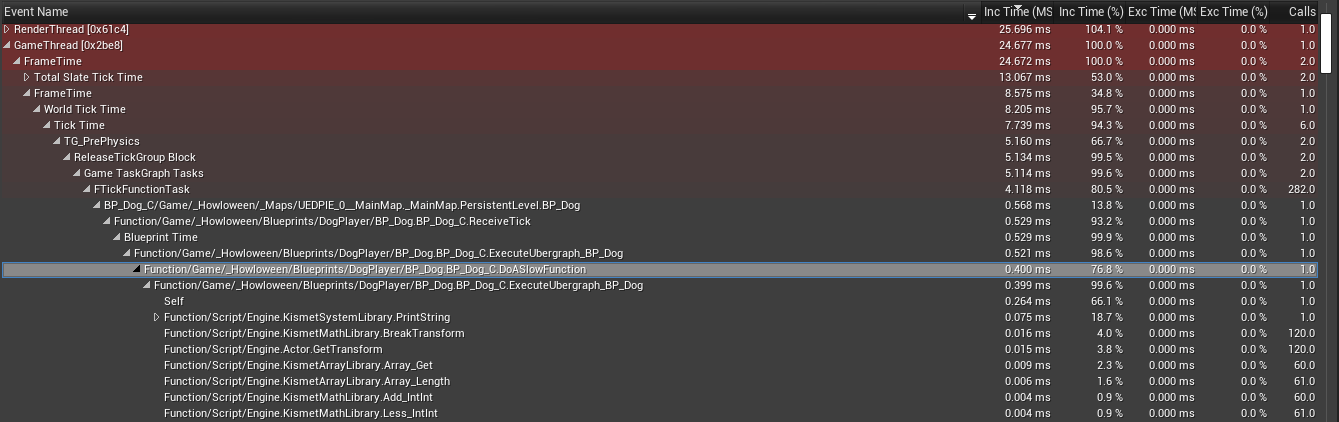
Here we can see our slight improvements from .437 ms to .4 ms. That’s some improvement, and this can be enough for you, but most likely not too much. There can be some other improvements to be made here, and realistically you might just not want to structure your interaction determination with a function like this, but we can even make more improvements to this function if we bring it into C++!
Now, I will show the code of converting this to C++, but this is not a guide on writing C++, this is more to demonstrate the optimization potential here for small functions that run slowly in your blueprint. Here is the code to convert what we have right above.
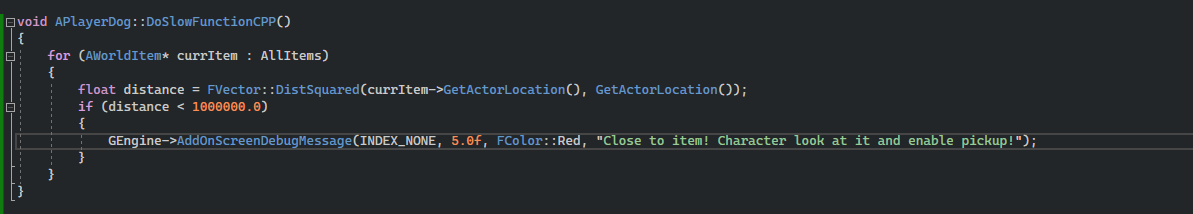
And this results in the timing info listed here:
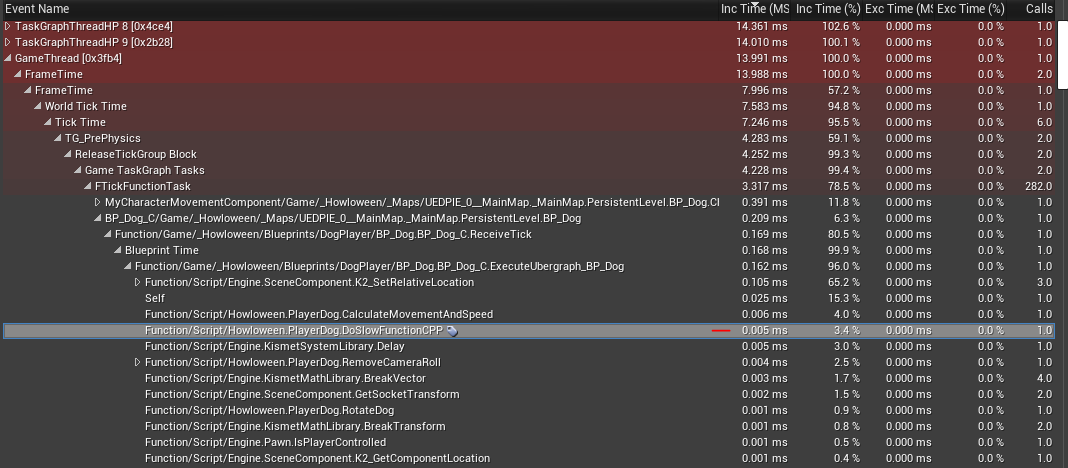
Now we can call this function from our blueprint and BOOM! Look at that speed, now we dropped from .4 ms to 0.005 ms! That’s a 98.75% speed increase! Quite insane what the power of C++ can do for your game! It is a lot of work, and if you have many variables and classes defined only in blueprint, it can take a while, but you can’t deny the impact adding even a few cpp functions into your game.
The main thing to consider when creating your projects, is to always try and have variables and structs stored in your C++ to make the process easier later. If you have been working in a blueprint-exclusive project thus far. To convert them to C++, you want to find out what parent your Blueprint is based on, then you will want to create a C++ file with the same base parent. Once you have this compiled, you will want to go back to the blueprint that you are trying to update, and change the parent to your new cpp class. Now their parent is the cpp file, and anything defined in the cpp will exist in the child, and you can create functionality to live in cpp or be implemented in blueprints.
Common Blueprint Time Sinks
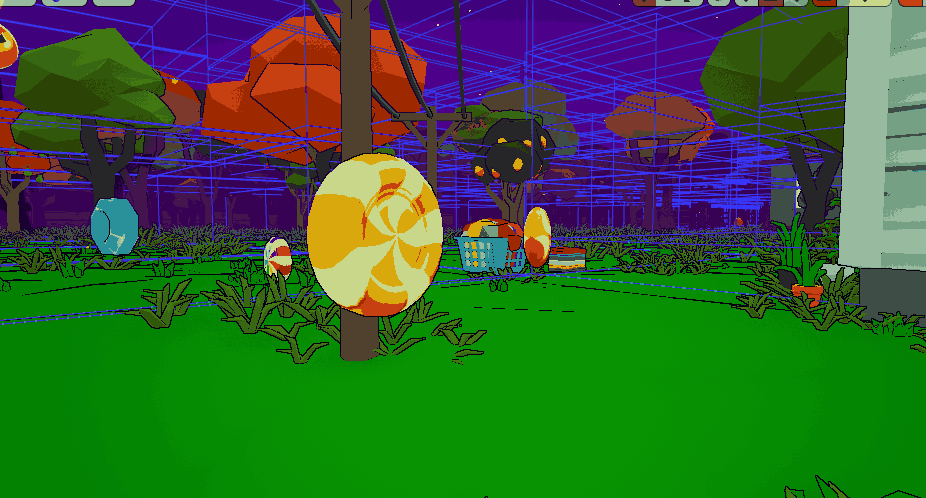
Bobbing/Rotating “Animation”
One common use for blueprints is to rotate or bob an item such as floating coins. THIS IS BAD! Unless you need to physics to be updated and need to have the updated positions, doing this in a shader would be much better as the number of calls and updating the position is time consuming, maybe not much for a single object, but for many, they add up. Here we have a bob-rotate defined in a blueprint with a timeline:
This implementation lives in blueprints via a timeline that controls the rotation and bob rate, and this plays forever, using the stat-game command, we can see more info about how long this is actually taking.
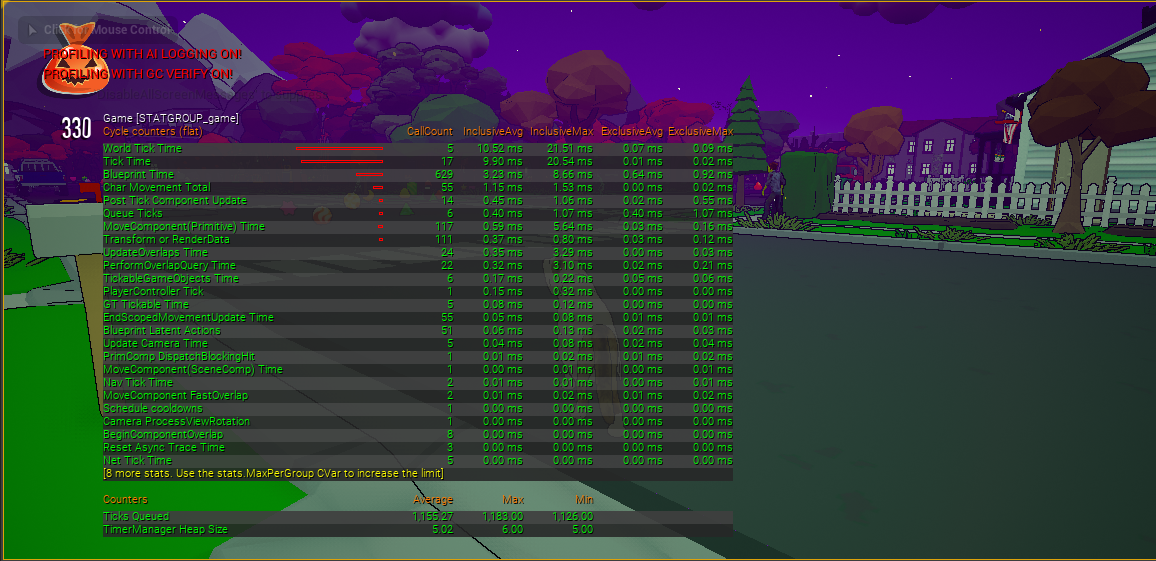
We can see here that lots of time and many call counts are being made with the MoveComponent(Primitive) Time, we have 117 calls over .59 ms and our total blueprint time including execution time taking 10.52 ms. This kind of motion can very easily and quickly be converted over to world position offsets within a material shader. We can use time, a Sine and Cosine wave and then move it over like this:
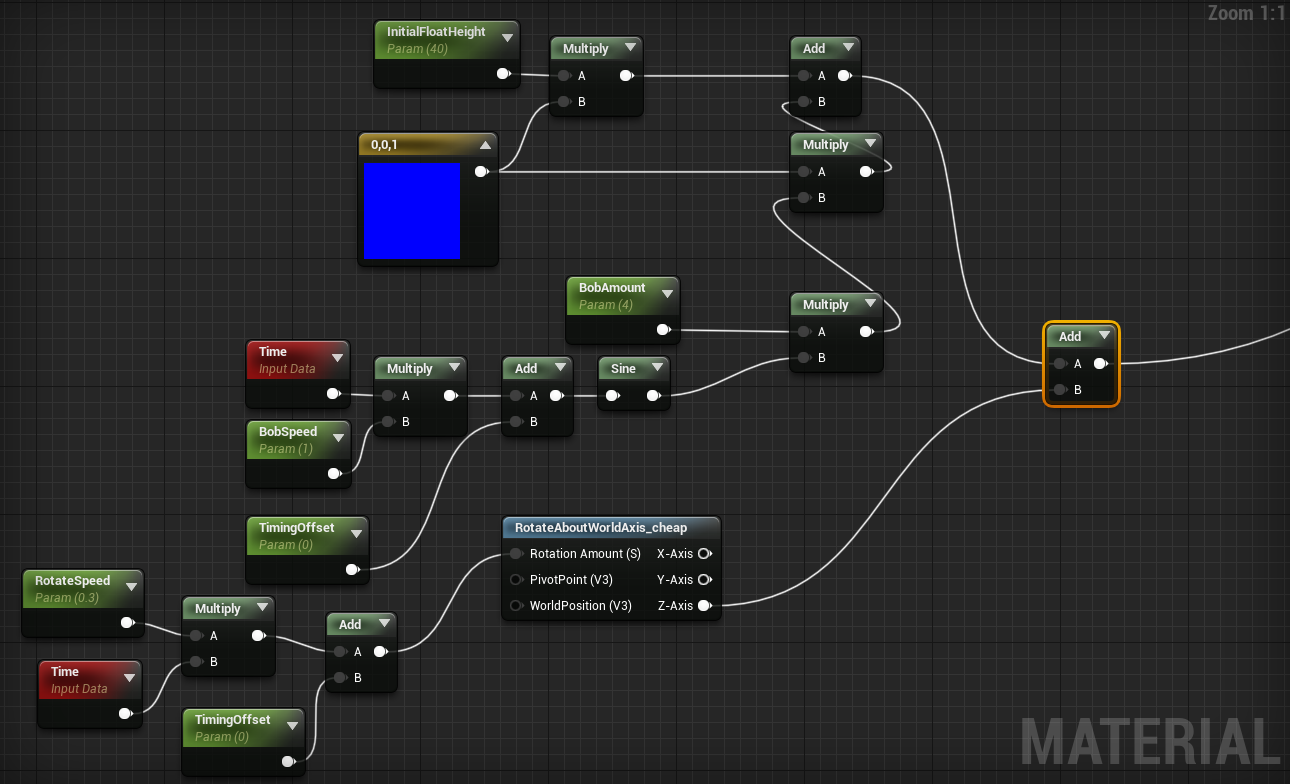

Once we make this change, we can remove all the blueprint code that is running bobs and rotations and we can re-look at the game timings to see how much of an improvement we got.
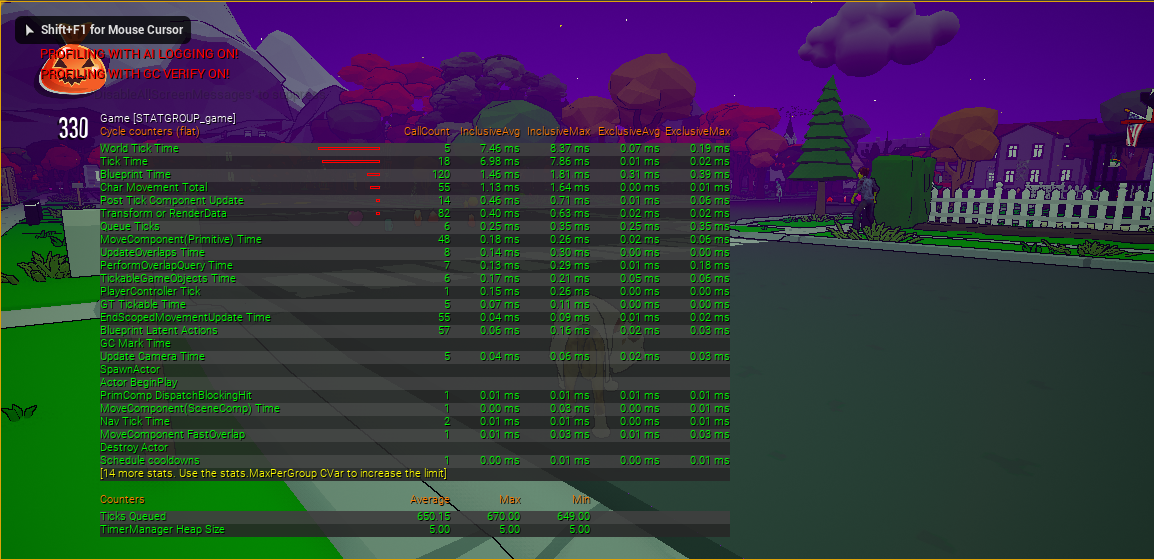
Now our blueprints are running with 7.46 ms, a great improvement from 10.52 ms! That’s about a 29% increase! The MoveComponent cut down to 48 calls with .18 ms and Blueprint time cut down from 629 calls to 120, and cuts from 3.23 ms to 1.46 ms.
Quite a vast improvement for something that seems so minute!
Tick every frame
Ticking every frame is sometimes critical! However, most blueprints don’t need to tick every frame and can tick less frequently. Try utilizing event dispatchers to call things only when needed, setting timers on functions for things only as needed, or lowering the tick rate on the blueprint’s class settings. Often you don’t need to tick every frame.
User Widget Variable Bindings
Binding a value to an item on a User Widget is the same as having it tick every frame to grab the value, try as much as possible to only update UI elements when needed. Just don’t do this outside of debug purposes.
Conclusion
Blueprints can be slow, especially if you don’t develop all your code optimally (as nobody does during development). Proper analysis can make sure that you improve only the functions that are slowing you down and make sure that when you do make changes, it leaves you with a large impact that feels like you made major strides!

