City Builder Technical Challenges of SIMPHL
Hello! ! Thought I would give a quick into as this is a long post. I want this to be a medium-high level overview of some of the technical challenges we faced while developing the city tech in SIMPHL. This project had interesting limitations as we wanted to use Unity, utilize real building data, render and simulate over 17,000 buildings, and ship on the WebGL platform. The solutions we developed were fun, interesting, creative and pushed our technical skills to the next level. The problems faced during this development are so interesting that I can’t imagine not sharing them, so here they are!

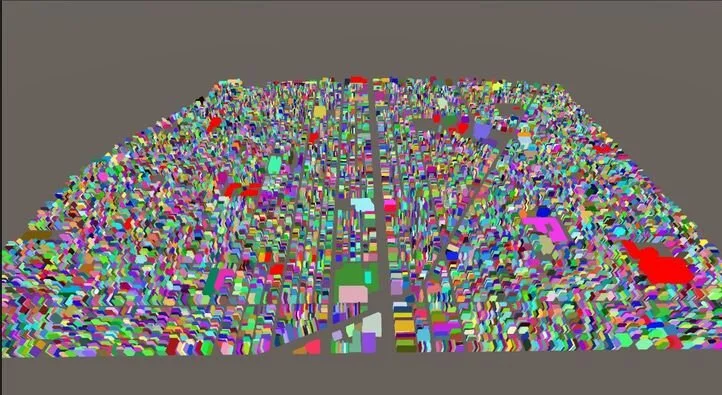
The resulting city, with coloration based on the initialized zoning information from the real dataset. Green is residential, Blue is commercial, Yellow is Industrial, and Magenta is missing data from the data preprocessing.
High Level Technical Overview:
SIM PHL is an interesting project in that it involves utilizing real-world data and tying it into an interactive, virtual world, in a game format. In order to accomplish this, there is data that we use to get accurate building data. A second dataset is used to give us an understanding of how these buildings are laid out spatially inside of the virtual world. These two datasets differ greatly. Because of this, the datasets need preprocessing work to tie them together. For the game, we also need to generate art to represent the buildings in the city. This art is layed out based on the spatial dataset that we have pulled from. This process needs to be as procedural as possible, as any manual work in tying over a city would take too much effort and take too long. You can imagine the immense workload that would be required if we ever wanted to move the game to a new area in the city. Once we have the combined dataset and the 3-D models representing the city, we need to do one final step of tying the data to the 3-D models within the game engine, Unity. From this point, we can click on a 3-D representation of a building and access any of the data we want that pertains to that building. Once this base version is working, we then try to move towards a spot where we can support our target platform, WebGL, with adequate data storing, and performance taken into consideration.
The DataSets:
In developing a city builder that utilizes real buildings with their real data, we need a dataset to give us all the information we care about. Thankfully, the city of Philadelphia has made property assessment data publicly accessible via their Open Data Initiative. This provides us a service to be able to download, in csv format, all the property data for the nearly 600,000 buildings in Philadelphia. The dataset includes information such as: building zone, category code, market value, taxable land, taxable building, street address, number of stories, latitude, longitude, and more. The information supplied here is more than enough for us to be able to represent the buildings in our city simulator. The problem here is that we only have the abstract information about these buildings, we do not have any physical concept of how large these buildings are or where in space they are positioned (apart from the latitude and longitude values).
In order to create the physical form of the city we determined we needed another solution or dataset. To get this information, we initially looked to the Google Maps SDK for Unity. The Google SDK allows the programmer to provide a position in latitude and longitude. Google takes this coordinate and loads the surrounding buildings within a radius. For each building that it loads, a google ID comes along with it that allows us to look up more information about the building. We could use this Google looked up information to pair the ID with our dataset in-order-to give each building’s physical form a set of abstract data to reason with. This approach was working rather well, however there were a few major problems that we ran into. The main issue was that dynamically loading all of the mesh data of the buildings to get the IDs took time, but then also having to reverse lookup all of these IDs to get the building info and compare it with our dataset took even longer. Not to mention that reverse looking up this data via their GeoCoding API costs money per every lookup. Having to perform this lookup on 1000s of buildings every time the game started up was not cost, or time effective. Thus we decided to perform all of these lookups before going into the game engine. Utilizing a couple python scripts, I could run through the list of all our buildings and look them up via the latitude and longitude of the building. This data would then be saved out to a text file that we could then look into for free. However, this reverse-lookup process had its own problems. It could be a problem with the Philadelphia data, or the Google data, however, the reverse lookup process could not find about 12% of the buildings that I was looking up, meaning we couldn’t get data for around 12% of the buildings in our play-space. On top of this, all the art for the city had to not only be procedural, it had to be procedural at runtime when the base buildings were loaded, nothing could be preprocessed. Finally, we could not view the buildings in the Unity scene in our editor without being in play mode, as the buildings got loaded once you started playing. With all of this in mind we started looking for other solutions where we could have better control over the look of the city and be able to freely look-up data and refine how it determines which building is found.
Looking into MapBox was our second thought, and almost immediately, we could tell that it would be no different than Google Maps. Our needs for this project are much too specific and the use-case is much too unique for any of these out-of-the-box solutions to seamlessly integrate into our workflow. This is when we landed on OpenStreetMap. OpenStreetMap is a map dataset, where all of the data is community driven. Members may edit the map, add building geometry, and any other data that would be important to know. Most importantly for us, we had just recently learned that all the buildings for Insomniac’s Spider Man were generated in Houdini, using the OpenStreetMap dataset. To generate buildings with OpenStreetMap, one only has to export the data, and import into Houdini with the city reconstruction settings, and a 3-D mesh is generated with the OpenStreetMap information mapped into it. From here, we can customize the visuals of the buildings before ever going into the game engine, it can all be precomputed. We also are able to have these 3-D buildings export with the OpenStreetMap Ids associated with them. Now we just need to tie the Philadelphia data over to these OpenStreetMap Ids, and the buildings would be associated with their data. However, this is no simple process as there is no one thing that is tying the two datasets together, the closest would be the street address, or the latitude, longitude values. Unfortunately, the street addresses on OpenStreetMap are community sourced, making them likely to be incorrect or not supplied. This pushed us to need to use the latitude/longitude to tie over the buildings. However, these values are subject to much ambiguity, as these values are extremely precise, if someone where to measure the lat/lng values of a building, they could take that from the door, or the center of the house, that could include the backyard or be somewhere random, these values were never going to match. There is also the issue of not wanting to check if lat/lng values are “close enough.” If this distance check approach were to be taken, it would often be the case that a building’s lat/lng values would match that of their neighbors. Luckly, OpenStreetMap provides the “geometric” view of the buildings, supplying not just one lat/lng value per building, but a set of lat/lng points. These points, when connected, form a polygon. This allowed us to take a new approach. Using Python, we create the polygonal representations of all the OpenStreetMap buildings. From here, we grab the lat/lng value of a building from our dataset, and check which polygon our point lies within. Using this polygonal collision-based check, we were able to, fairly accurately, tie over all OpenStreetMap builds to the other dataset at about 12% accuracy. One of the main causes of this low accuracy is due to the community driven data aspect of OpenStreetMap. When looking into Philadelphia on OpenStreetMap, it is clear that many buildings have not been marked by any contributors, meaning that they could not be found within the dataset, as they did not exist. One job we have on this project is to make the game-area somewhere that has most of the data supplied already, and for any data that is missing, we should try our best to supply it. Now, with 88% of the buildings tied over, we were able to integrate the art and data into Unity.
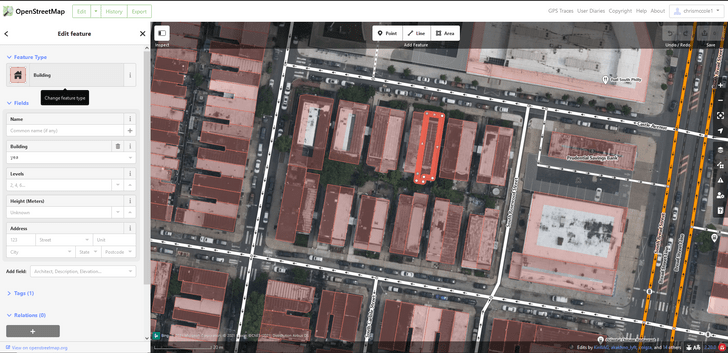
Open Street Map in Edit mode where you can see the building outlines. Vertex positions, and building information.
Unity:
Parsing all of this data inside of Unity is the easiest step in this process. As we have all of the data precomputed in formats that we have created or understand, it is a very simple parsing process to load all of the data. The first thing that we do is load up the csv file with all of the building data and the OpenStreetMap Ids listed with the building data. Line by line we read out any information we care about and fill our building struct with the information. As these structs are being created, we are mapping them into a dictionary that maps the OpenStreetMap id with the building structs. Once this parsing is complete, we run through another script that looks at every 3-D building in the game engine and get’s the OpenStreetMap Id from it. Using that Id, it looks into the dictionary mapping OSM Ids to building data. Upon successful retrieval of the building data, we change the building’s appearance based on zone, in-order-to properly visualize that we have successfully gotten the data.
Showing the buildings, with information displayed in a panel that follows the screen. This is from an old version of the game in which each building was a separate mesh.
Optimization:
It is at this point in the process, where everything is working, that we begin to think of performance constraints and requirements of the WebGL platform. Upon starting to play the game on high-end PCs, we instantly noticed that it was running at an abysmal 10 frames per second (FPS). If we wanted this game to run well on WebGL we needed to overhaul the entire process up to this point. First, we knew we had to test and figure out what exactly was causing the slowdown. It was very obvious as we, at this point, had no real code in the project. There were just 17,000 buildings, all as separate Game Objects rendering inside of Unity. The first thought was that all the buildings were separate meshes, and that by combining meshes and materials, we could reduce our batches and achieve good performance. This was incorrect, it had almost no effect on the performance of the game, what was really causing the performance issues, was the sheer number of Game Objects within Unity, and the engine itself could not upkeep all of these objects. This would be a big issue if we wanted to continue using this engine. Unity is known to export out to WebGL fairly well in comparison to other engines. Looking into Unreal Engine, it seems as though it does not scale down to WebGL nearly as well as Unity, and our team also has much less experience working in WebGL. Another thought would be to build it in our own engine or straight into Javascript. However, our team also has little experience in this realm, and if we wanted to export to other platforms, the porting process would be extensive. Considering that this project is, at this point, on a 6 month timeline, we figure that it would be too large a task to jump-ship from Unity.
So taking inventory of our current situation, we want to show and simulate 17,000 buildings within Unity at a reasonable framerate. Immediately, we thought of combining all of the 17,000 building meshes into a single city mesh. This worked wonders, and ran at .4-.5 ms/frame on our machines with ease. This does introduce a new issue though, we still need to simulate 17,000 buildings, and treat them all separately, and tie the data to the building within the city mesh, and have all of the buildings look different, based on their zoning values, market value and so on. How would we do this with everything stored as one mesh? Well, we broke up the process into a number of small steps that would come together for a big result. Firstly, we knew that we needed to still be able to click on a single building and get its information from it. We needed these “clickable” buildings to line up properly with the visualized buildings on screen. And we needed to be able to update these “fake buildings,” and have it affect the visuals of the real mesh that players see, in real time. If we could develop all of these things, we could keep the data representation of the buildings completely separate from what the players actually see.
The first step was to create these “fake buildings” that we can place into the world and click on from the screen. There were two main approaches that we considered. One, using the Unity Raycast, coupled with a mesh-collider to click on the mesh, and get out the triangle that was hit. We could then store a map of all of the triangles that correlate to the buildings. This was a quick thing to write up and test, however, the triangles proved to be difficult to work with as there were actually many meshes, all with different triangle sets. The second option was to create representations of the building shapes in code, and then write our own raycasting function to cast into our non-Unity, code-only world to see what building we hit. This functionality is completely unrelated to Unity, and uses no Unity API, it is almost entirely just C#. This process of creating bounding boxes and raycasting required lots of incremental development and testing. As we had to develop code to form boxes in 3D space, create our own vector math functions, and debugging code and testing code to ensure that it was working as expected. Creating a bounding box was simple enough, all that was needed was a struct to hold the min/max x, y, and z coordinates. I then wrote some Unity code to be able to draw these bounding boxes to the screen, by constructing a mesh of the space, and drawing it. Once we were able to get a single unit-cube to display at origin, we messed with moving, scaling and rotating the cube. Then we wrote code to dynamically create 2-D and 3-D grids of cubes to ensure that they were all being created and placed properly
The original building mesh, and I am toggling on and off the drawings of the bounding box versions of the buildings that I have developed.
The next thing we needed was to be able to take a raycast, a segment starting at one point traveling in a direction until reaching a given length, and output the bounding box that was first hit. This was substantially more complex as it could not rely on any Unity specific code if I wanted to utilize the Burst Compiler for optimization purposes. This involved the creation of a simple math library containing: dot product, vector projection, magnitude, normalizing, vector creation given origin,direction and magnitude, as well as equality checks. From here, there were many test cases developed to draw a ray from origin, in the direction of each axis. From there, we varied the lengths of each ray, changed where they were pointing, changed the starting point of the rays, constructed rays given start and end points, projected rays, etc. This was all visualized using the Unity Built-in drawing tools. Assertion methods were used to check the addition, subtraction, multiplication, division and construction of these raycasts. Now, we just needed to create a function that would create this raycast, and then move along it to find the first entity hit by the ray, and return it to the caller. A naive implementation was constructed and ran terribly (>100ms), however when formatting for burst compilation it was able to run in less than 22 ms. From here, a more substantial version was developed by first creating a bounding box for the raycast, and immediately eliminating all buildings that did not fall within the bounding box of the raycast. Using this implementation the raycast would run on average in 5 ms with 30,000 objects. Stress tests were developed to spawn raycasts along a sphere, all pointing toward the origin, stopping when they hit the bounding box in the center. This test visualized how precise it was at determining when it hit the bounding box, but also showed how quickly it could perform thousands of raycasts. Further tests were developed to raycast into the 2-D and 3-D grids of cubes, spawning spheres wherever it hit. Once the raycasting was fairly well developed, we moved to testing raycasting from the screen point that the user had clicked from. This functionality was able to very easily integrate into the already existing functionality and worked very well with testing clicking on buildings inside of the 2-D and 3-D grids.
Now that we had the major components of raycasting into these bounding boxes, we needed to create the bounding boxes in the shapes, and positions of the buildings in the actual city. I also needed to get the building Ids into these “fake buildings” so that they could map over to the dataset when the time came. To do this, we initially wanted to reconstruct the city using a .fbx file. This is the standard file format for 3D art assets within Unity, so it seemed like a good way to parse out what we needed from it. However, the .fbx format is proprietary, so learning how to parse this format seemed to be extremely difficult. From here, we had thought to use the .obj format however, we realized that this format did not support vertex colors, something that we would need for development later down the line. Finally, we settled on the .dae, or COLLADA file format. The COLLADA format was simple to parse, and contained all information about the mesh that we needed. Now it was just a matter of parsing the COLLADA mesh file and reconstructing bounding boxes in accordance to the vertex positions listed in the file. This was a fairly simple process, and seemed to work very well when rendering the COLLADA mesh, on top of the debug rendered bounding box version of the city. The main issue here came in with the vast size of our city and the constraints on WebGL. As our city was massive, this COLLADA file was ~500MB and we needed to create structures and dynamically allocate arrays to parse each line in the file. WebGL could not handle the memory allocations and ended up crashing upon parsing this large file. To fix this issue, I ended up creating my own file format for our use, an EPA (Easily Parsable Asset) file that shares much of the same structure as an obj file, however, supports vertex colors and treats new-line characters more sparingly.
To make sure this was all working there was one final step. That step was to develop tools that allowed me to click on a building, and get back the building name. I was able to render the large, single mesh, reconstruct the buildings into my “fake building” bounding boxes, raycast into them with my custom raycast code, and get the building ID from the dataset when I clicked on it. All of this functionality worked perfectly and ran at extremely fast speeds, apart from the unoptimized raycasting code
Now, the only issue remaining is that we still can’t visualize each building in this large 3-D mesh separately. If we have one building that is residential, and another that is commercial, we would like the one to appear green while the other is blue. There are a couple of ways to tackle this issue. One would be using the vertex colors, and setting the vertex colors at runtime by “painting” them with your zoning tool. This would lookup all the verts inside of a building’s mesh, and see which are within range being painted. Then they would be assigned the zone of whatever the brush was set to. This approach would have a couple issues. The iteration over all the vertices would be extremely slow. It would also be possible to only partially paint a building, which would lead to odd results. The mesh painting would be separated from the building data, which could potentially not line up. Finally, the mesh would have to be writable at runtime which would mean it couldn’t be statically or dynamically batched, leading to worse performance. The other option that we developed would be to instead utilize a shader to draw the buildings differently based on data in the vertex that it’s trying to draw.
All of the buildings rendering the color at their pixel in the texture, the texture was assigned random colors to every pixel, resulting in a randomly colored city.
The way that we could tie together the “fake building” data with the visual representation, could be that they both share a texture that stores all of the information about all of the buildings. This texture would be set up in such a way that each pixel corresponded to a specific building. The position of this pixel could then be encoded into the vertex colors of the mesh. And the building information could cache this pixel location into it’s dataset during the initialization of data. Then, when drawing the mesh, a shader would have access to the vertex, and it’s colors, that it’s trying to draw. Using this vertex color, it could decode the pixel to lookup in the texture, get the color at that pixel, and utilize the color information at that pixel to decode information about the building’s zone, upgrade level, selection status, etc. This information would then tell the shader how to draw that vertex. To accomplish all of this, we wrote a python script to go through the COLLADA file and add in the vertex colors in incrementing order so that we could get the index back out. So we started with red, green, blue and alpha (r, g, b, a) values all equal to 0. And for buildings 0-255, we incremented r from 1 to 255. When moving to building 256, r got reset back to 0, and g was incremented to 1, for a resulting r = 0, g = 1, b = 0, a = 0. This vertex color would correspond to a pixel to look at in the lookup texture, so to get that pixel index back out, it was a simple algorithm: vertexCol.r + (vertexCol.g * 256) + (vertexCol.b * 256 *256) + ( vertexCol.a * 256 * 256 * 256). This way, for the color r = 72, g = 94, b = 0, a = 0, we get the resulting index 72 + 24,064 = 24,136. So, If we wanted the pixel at this index we would be able to simply modulo by the dimensions of the texture to get the pixel x coordinate, and divide by the dimensions to get the y coordinate in the lookup texture. This process was done inside the Collada file, as this was simple to add in, as the Collada file is parseable. To display it inside of unity, we imported this collada file back into Blender and exported it as one large mesh in fbx format. This allowed us to script the process of adding vertex colors, and let us use the fbx file format. As mentioned before, we also then used a script to convert this Collada file into the EPA file format developed.
Now that we have assigned unique vertex colors to the mesh, we can parse these out inside of Unity and tell our “fake buildings” what pixel to update in the lookup texture to affect the visuals of the 3-D mesh. And in the shader for the 3-D mesh, it gets the current vertex color out from the vertex, translates the color into the pixel coordinates, and looks up the color of the pixel in the lookup texture. From here we can encode lots of information inside of the vertex colors. Currently, we are utilizing the blue channel to determine which zone the building is part of. As these color values are floating point, we determine that buildings with blue value 1/255 are commercial, 2/255f are industrial, 3/255f are residential, and 4/255f are special purpose. We plan to use the other red, green and alpha channels to include information about building upgrade level, if the building is selected by the user, if it is highlighted from a filter, value information, etc. And the shader can determine how to display the building based on this information from the texture.
Rezoning the thousands of buildings within WebGL using our advanced techniques.
So that’s it! That is the medium-high level overview of the SIMPHL project and its major technical challenges that we faced in terms of utilizing real building data, displaying buildings, and being able to interact with them and change them at runtime in a performant manner. If there is any interest here, I plan on furthering my posts on this development process by creating a step-by-step tutorial of this entire process that we went through. I think this was an incredible learning experience as it really pushed our technical knowledge, got us to think in a more data-driven manner, introduced us to Burst compilation, and made us think creatively about interesting solutions to a complex problem. Thanks so much for reading!